Revised: January 2019
By Sarah Owens and Michael Livingston
 |
| Image: Kitwe Co, UK |
Those who don't live in the world of homeless services delivery, or haven't made a study of it, might be unfamiliar with these tools. The purpose of this post, and the next one, is to give readers some idea what they can do.
HMIS is concerned primarily with housing. HUD requires every continuum of care (CoC) to inventory the housing available in their community, and issue an annual Housing Inventory Count report.
When an Oregon provider enters bed-usage data in ServicePoint, HUD counts those beds as "HMIS-covered." A high bed coverage rate means the data will be meaningful. CoCs that have high coverage rates are better able to compete for HUD funding. Here's what the HMIS-coverage situation looks like in Region 7, based on the last bed inventory count (shaded = not covered):
Region 7 2016 Housing Programs
Program
|
*
|
Fam Units
|
Fam Beds
|
Child Only Beds
|
Adult Only Beds
|
Total Beds
| |
S
|
Salem IHN
|
4
|
14
|
14
| |||
S
|
Center for H&S
|
DV
|
3
|
13
|
2
|
15
| |
S
|
UGM Simonka
|
5
|
18
|
78
|
96
| ||
S
|
UGM Men’s
|
114 (+94 overfl)
|
208
| ||||
S
|
Sable House
|
DV
|
10
|
10
| |||
S
|
Polk County
|
3
|
3
| ||||
S
|
NWHS SOS
|
15
|
15
| ||||
S
|
Total Beds
|
361
|
Program
|
*
|
Fam Units
|
Fam Beds
|
Child Only Beds
|
Adult Only Beds
|
Total Beds
| |
TH
|
St Francis
|
14
|
46
|
46
| |||
TH
|
St Joseph
|
17
|
51
|
51
| |||
TH
|
Salvation Army
|
84
|
84
| ||||
TH
|
Shangri-La
|
2
|
4
|
14
|
18
| ||
TH
|
Grace House
|
9 (W)
|
9
| ||||
TH
|
UGM Men’s
|
56 (M)
|
56
| ||||
TH
|
Titus Hse
|
AD
|
6
|
6
| |||
TH
|
Shelly’s Hse
|
CH
|
17 (W)
|
17
| |||
TH
|
Rstration Hse
|
CH
|
48 (M)
|
48
| |||
TH
|
HOB
|
V
|
5 (M)
|
5
| |||
TH
|
NWHS
|
8
|
8
| ||||
TH
|
Total Beds
|
351
|
Program
|
*
|
Fam Units
|
Fam Beds
|
Adult Only Beds
|
Total Beds
| |
PSH
|
SHA-CHDV
|
3
|
15
|
6
|
21
| |
PSH
|
SHA-VASH
|
6
|
20
|
48
|
68
| |
PSH
|
NWHS-HOAP
|
9
|
9
| |||
PSH
|
Shangri-La 0
|
4
|
8
|
12
|
20
| |
PSH
|
Shangri-La 2
|
3
|
5
|
4
|
9
| |
PSH
|
Shangri-La B
|
5
|
5
| |||
RRH
|
CAA-SSVF
|
2
|
8
|
3
|
11
| |
RRH
|
CAA-OHCS
|
3
|
10
|
7
|
17
| |
RRH
|
CAA-ARCHES
|
10
|
23
|
20
|
43
| |
RRH
|
CAA-ARCHES
|
2
|
4
|
3
|
7
| |
Total Beds
|
210
|
S-Shelter TH-Transitional Housing PSH-Permanent Supportive Housing RRH-Rapid Re-Housing DV-domestic violence AD-alcohol/drug addiction CH-criminal history V-veterans SHA-Salem Housing Authority
CH&S-Center for Hope and Safety CAA-MWVCommunity Action Agency HH-Household NWHS-Northwest Human Services HOB-Home of the Brave (closed summer 2016) CHDV-Chronically Homeless Disabled Vet SSVF-Supportive Svces for Vet Families
Housing Type
|
Total Beds in HIC
|
Total DV Beds in HIC
|
Total HMIS Beds
|
HMIS Coverage Rate
|
Shelter
|
361
|
25
|
14
|
4%
|
TH
|
351
|
0
|
124
|
35%
|
PSH
|
132
|
0
|
34
|
26%
|
RRH
|
78
|
0
|
78
|
100%
|
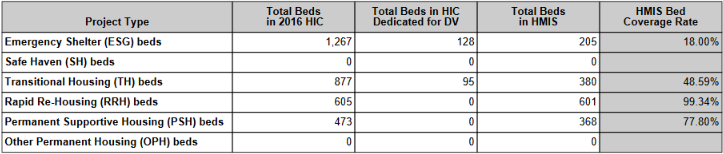
These rates are so low (RRH excepted) as to limit the usefulness of the data as systems measures. Region 7's rates also drag down ROCC's rates (see below) (though Region 7 isn't the only one doing this), and limits the usefulness of ROCC's data as systems measures. For that reason, they also harm ROCC's ability to compete on a national level for CoC Program funding.
 |
| ROCC's 2016 Consolidated Application |
 |
| ROCC's 2016 Consolidated Application |
Translated, ROCC is acknowledging that it has not been able to persuade non-grantee providers (i.e., providers who don't receive HUD funding) to use ServicePoint. We would question whether ROCC is "diligently working" to obtain those providers support. Barriers include 1) license fees ($350/yr), 2) staff time (a few hours/wk), 3) philosophical objections, 4) security objections, 5) culture of non-cooperation among providers.

However, the BUR here is not based on sufficient inputs. The BCRs for ESFAM, ESIND, THFAM and THIND are too low because too few providers participated in HMIS.
Other ROCC measures (Average HH Size, Length of Stay), are similarly unreliable.
(When HUD has finished reviewing the data in this report, asterisks will appear by "ESFAM, ESIND, THFAM and THIND" to indicate those coverage rates are unacceptable.)
Next: HMIS and Coordinated Entry
No comments:
Post a Comment